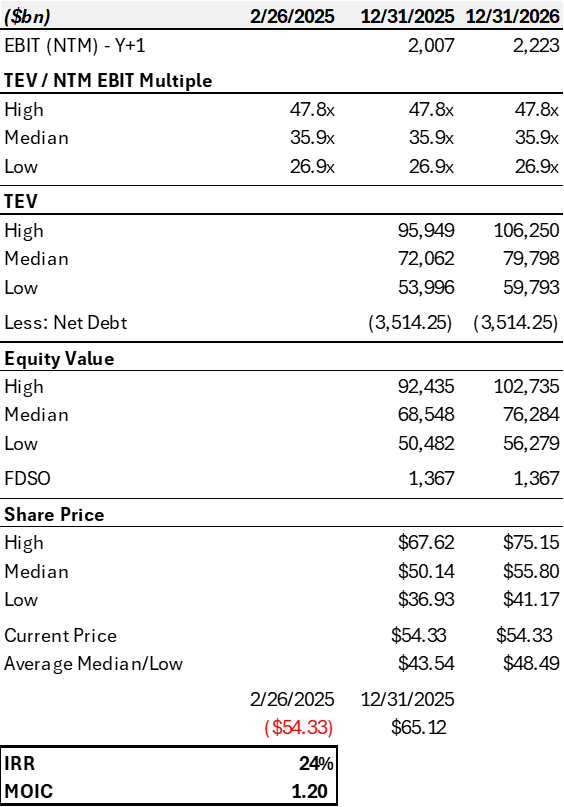
SHORT position on Chipotle generating a ~24% IRR over a 1-year hold period
I recommend either to put on a short position on the basis that the business will underperform consensus estimates on a sales and margin basis driven by slower
growth in new restaurant adds and impact on key inputs to food costs in 2025.
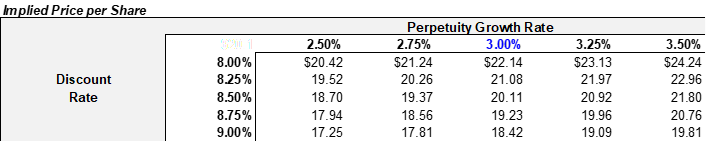
My target price is ~$43 / share over a 1-year hold period, generating a ~24% IRR
•The drivers of idiosyncratic value are specific to:
•Margin pressure driven by key food inputs spiking protein and avocado prices
•Chicken, beef and avocado costs make up over ~14% of revenue
•Certain inflationary trends including tariffs have started to spike corn futures, impacting feed costs materially for chicken and beef
•Furthermore, key fertilizer inputs that affect avocado prices, including natural gas, sulfure, and potash futures prices have spiked in excess of 30% (sulphur futures are trading at levels 70%+ vs. ‘24 and natural gas 29% YoY for Dec ‘25 futures
•Furthermore, additional inflation in labor and supply/demand headwinds are impacting prices as well
•Additionally, after a period of outgrowth above guided new restaurant adds, the company, based on previous guides and beats/misses, may be in store for a much slower restaurant growth
•A high correlation of .9 between guide growth rates and YoY actual new restaurant adds shows there is some cyclicality you can track and use to forecast new restaurants; after a beat on mid-point guidance this year, based on historicals, we should be in for some contraction in restaurant growth in 2026E-2027E, leading to a top line miss to consensus figures
•I believe, over the near term, the market will come to realize this view as a couple main events evolve:
•Key input pricing for food costs catch up with lag (~3 months) in Q1- Q2 2025, with the business discussing impacts on earnings calls over the coming quarters
•Restaurant adds for 2026E are released towards the end of the year in 2025
My revenue forecast is built on a few main drivers: comparable restaurant sales and new restaurant openings, which the Company guides to and can help forecast CMG’s top-line
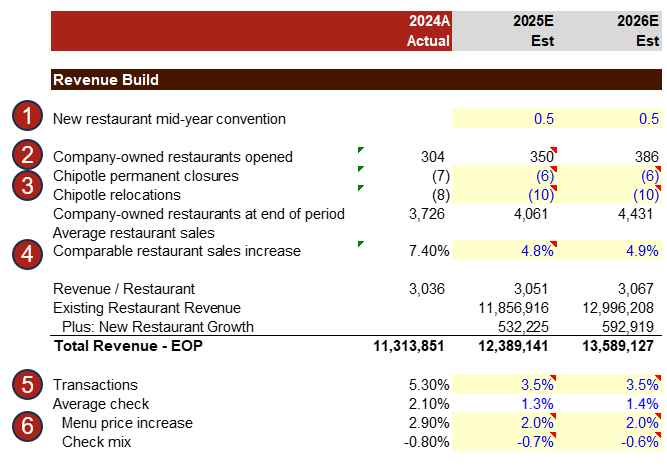
1.New restaurant mid-year convention is used to spread new revenue from 2025 new restaurants to account for the spread across quarters (ie. It is multiplied by revenue/restaurant * sales increase)
2.Company owned restaurants opened are forecasted based on average growth in YoY guides post-guidance beat since 2014, which is a .9 correlation to YoY growth in actual restaurant adds; the company is estimating between 315 and 330 restaurants to be built in 2025, but based on historicals, the company typically has a couple years of beats post-build miss – (ie. The company over builds – misses – reduces estimate – beats and overbuilds again)
3.Permanent closures and relocations are estimated based on historical averages
4.Comparable restaurant sales increase is comprised of Transactions+ Average Check Impact
5.Menu price increases I am assuming are in line with inflation (historically, Chipotle has had some challenges with cost-pass throughs – reports from Dec ‘24 highlight declining traffic expectations, with CMG missing same-store revenue forecasts, suggesting slowing demand; the company cut prices by 3% in October 2024, followed by a quick reversal to a 2% increase, indicating sensitivity to consumer wallets
6.Check mix negative impact to average check has decelerated recently, highlighting an increased mix to higher priced protein (e.g. smoked brisket)
My cost forecast unpacks food costs, a focal point in the cost structure, with key input costs spiking already in 2025, compressing margins
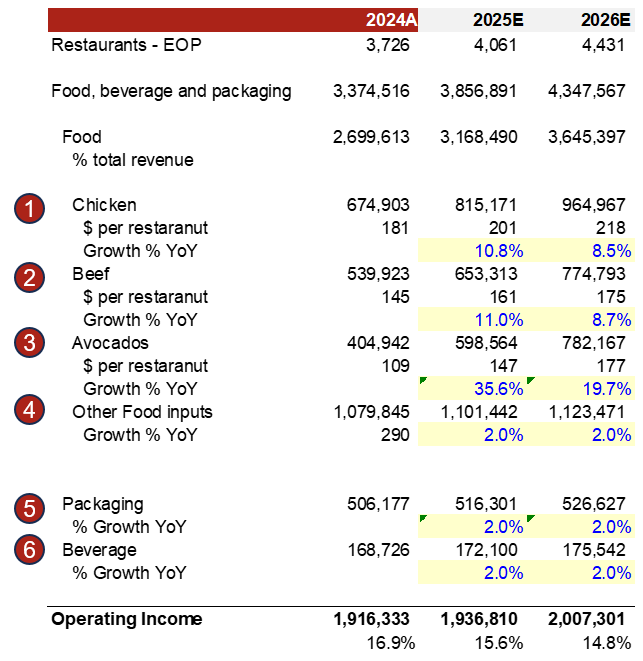
1.Chicken cost / restaurant growth is based on USDA WASDE supply and demand estimates for 2025E, with demand marginally outstripping supply causing a headwind; as well as corn futures and USDA corn price forecast for 2025
2.Beef cost / restaurant growth is based on USDA WASDE supply and demand estimates for 2025E, with both supply and demand decreasing but supply declining at a faster rate, as well as an increase in feed costs
3.Avocado cost / restaurant growth is based on key fertilizer and energy inputs such as natural gas and potash, which are rising in CME futures
4.Other food inputs are held at Bureau of Labor Statistics (BLS) CPI forecast of 2% for 2025
5.Packaging costs are held at BLS’s CPI forecast of 2% for 2025; with the assumption that as digital mix shift increases, more packaging volume will be required, with efficiency gains offsetting the increases
6.Beverage costs are held at BLS’s CPI forecast of 2% for 2025
My model for forecasting food cost inputs is Demand Growth – Supply Growth + Feed/Fertilizer & Other Input Costs + Inflation
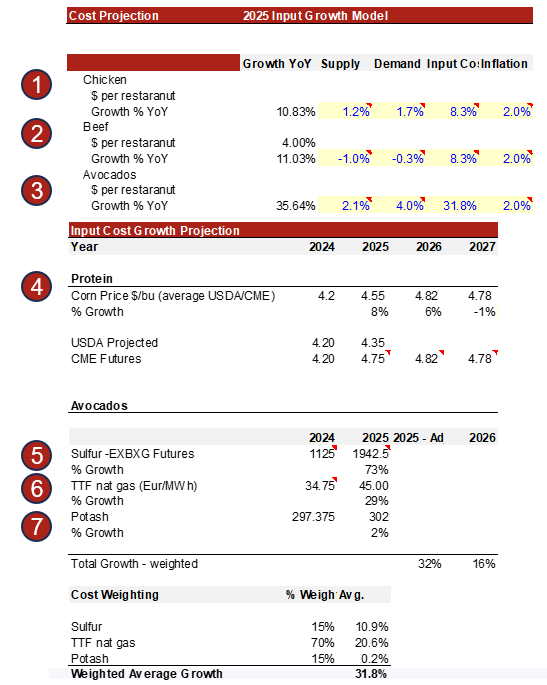
1.USDA is projecting broiler use (proxy for chicken demand) to increase from 39,983 million pounds in 2024 to 40,653 million pounds in 2025, a 1.7% increase and supply growing from 47,470 million pounds to 48,018 million pounds, a 1.2% increase
2.USDA is projecting beef demand to decrease from 28,717 million pounds in 2024 to 28,624 millions pounds in 2025 or -0.3% decline, with supply declining at a higher rate from 32,328 million pounds to 32,009 million pounds, a decrease of -1.0%
3.Avocado supply is expected to grow from 2.8bn lbs to 2.86 bn lbs or a 2.1% increase YoY, with demand estimated by the Hass Avocado Board to be in the ~4% range
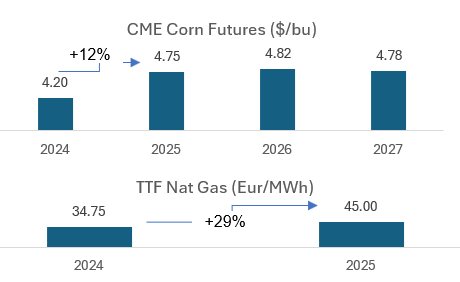
4.Assuming corn prices for 2025 are an average of USDA projected price of $4.35/bu vs. $4.20/bu in 2024 and CME Dec. 2025 futures currently trading at $4.75/bu; creating an 8.3% input cost increase to chicken and beef
5.Sulfur is a key input to fertilizer for avocado (~15% of costs) and based on EXBXG futures exchange, prices have skyrocketed in 2025 up 73%
6.TTF natural gas is a key input to avocado fertilizer and energy inputs (~70% cost driver) and futures in 2025 are averaging ~29% increase YoY
7.Potash is another key input to fertilizer (~15% cost driver) and is increasing ~2% YoY on futures exchanges
The most interesting component of Chipotle’s business, to me is their exposure to a number of different commodities that impact their key food costs
As a % of food, beverage and packaging costs, Chipotle cost mix is estimated to be 80%, 15, and 5%, respectively
Within the biggest bucket, food costs, chicken and beef are estimated to make up about 20-25%, each, avocados ~15% and the rest is made up by other food inputs
Although avocado’s are a small piece of the pie, they have relatively sizeable impact on the cost structure and have historically been volatile, leading to margin compression
With regard to chicken, beef, a major input to costs is feed pricing (primarily corn) which has risen ~8% from $4.2/bu to ~$4.55/bu this year based on USDA projections and current CME futures, an 8% increase
Chicken demand, as per the latest February USDA WASDE report, is forecasted to increase 1.7% YoY, slightly outstripping supply increase of 1.2%, causing a ~0.5% headwind
Beef demand is forecasted to decline -0.3% in 2025 and supply contracting -1.0%
Avocados are impacted heavily by sulfur prices, natural gas and potash, which go into fertilizer costs. Each of these prices have increased dramatically when looking at futures pricing, and when factoring in supply and demand, I am forecasting an increase of 35% for 2025
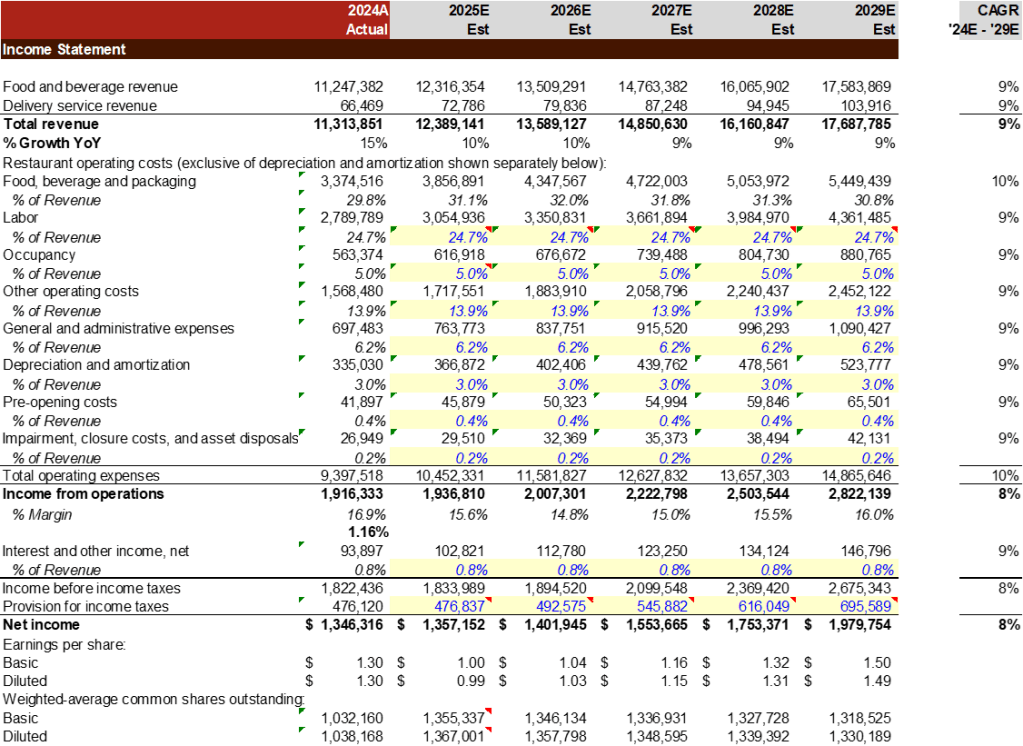
This impacts operating margins from 16.9% in 2024 to 15.6% in 2025E
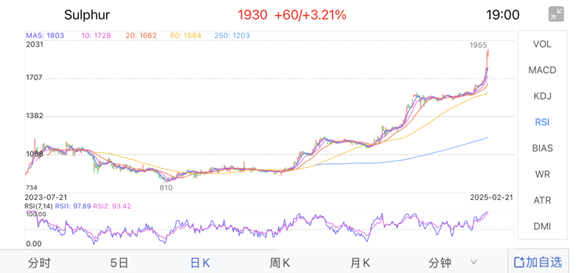
Certain inputs to underlying food costs such as fertilizer prices drivers such as China sulfur pricing (pictured above in current sulphur futures on China’s largest option exchange EXBXG) for nitrogen-based fertilizer can cause volatile swings in avocado pricing
Due to tariffs and other constraints, prices for underlying commodities have been spiking and futures are persistently high – all of which will put pressure on Chipotle’s margins in 2025
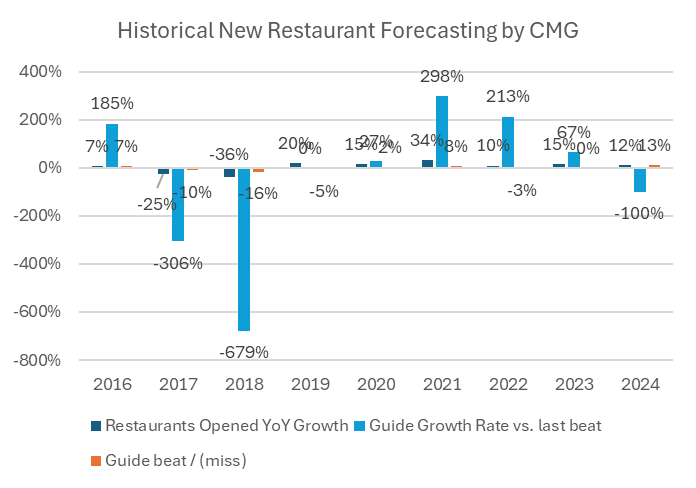
•I believe the growth story going forward and target to get to 7k restaurants is slower than analysts think, based on historical misses/beats to guided restaurant adds and their correlation to increased guides
•When running a correlation between guide growth rates (rate at which YoY units are guided up or down, to actual restaurants opened YoY it is 0.9, showing a high degree of correlation between how the company guides after they miss/beat on their guidance
•When modeling future restaurant openings based on historical average guide growth rates since 2014, restaurant build rates slow after a period of “overbuilding” or beating guidance, tempering a 5- year outlook to 5.5k restaurants by 2029
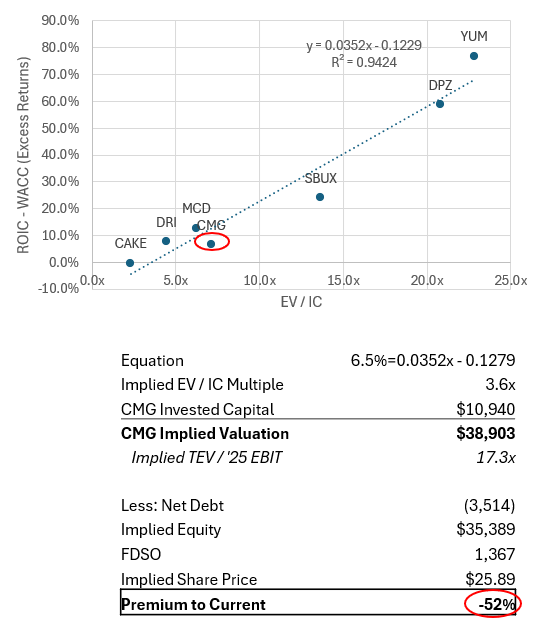
CMG’s excess returns show bottom quartile efficiencies compared to key public restaurant comparables

•6.5% excess returns on a calculated 15% ROIC and 9% WACC. As this relates to key public comparables like Starbucks, Yum! Brands, McDonald’s, Dominos, Darden Restaurants, and the Cheesecake Factory, CMG lands in the bottom quartile of the bunch. When running a linear trend with excess returns, it calculates a 0.94 R2 value, showing high correlation with TEV / IC
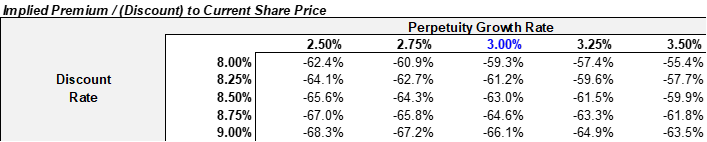
•When solving for CMG’s implied valuation based on their excess earnings of 6.5%, you return a value that is a 50% discount to their current share price at ~$54/share
•This underscores the business’s efficiency in generating profits from the capital invested in its operations, especially when benchmarked against its peers. Although the company is producing positive excess returns and thereby adding value for investors, it might not fully justify the premium valuation it currently commands.
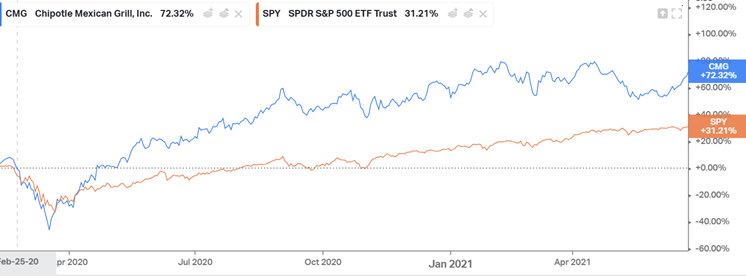
Chipotle has performed extremely well during market downturns such as COVID-19…
1.Resiliency during market downturns: the team has demonstrated excellent adaptability during substantial market downturns like COVID-19, where they pivoted to digital sales, growing them by 174% in 2020 to over 46% of sales and returning more than 2.3x the S&P, 18 months off of pandemic lows (see below chart)
2.Roll-out of new patented technology, optimizing the assembly line and implementing other new efficiency programs to boost operating margins 116bps in 2024A
3.Debt free strategy since IPO in 2006, the company utilized operating leases to expand its footprint and maintains financial nimbleness in the event of a market downturn or another strategic deployment of capital (ie. Leveraged stock repurchases)
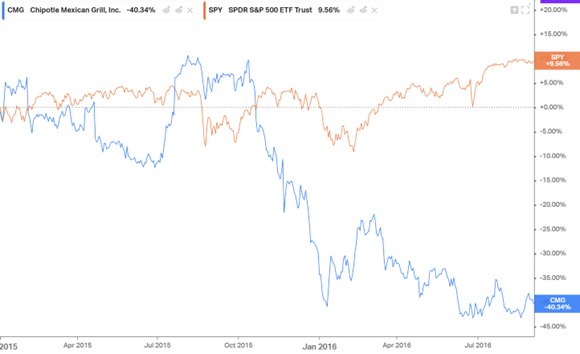
…but have struggled with margin pressure and consumer inelasticity and operational issues such as an e. Coli outbreak in 2015
1.In 2015 there was a E. coli outbreak at Chipotle damaged the business and dropped sales 13.3% in 2016
2.Margin pressure from rising costs, with price hikes shortly after price cuts (ie. Oct 2024), it exposes the sensitivity that the business has to customers wallet share, and indicate the inelasticity in marginal increases of ~2% price increases
3.Lack of excess returns (ROIC-WACC) versus key comparables (6.5% and 4th quartile returns vs. SBUX, MCD, DPZ, YUM, etc.) highlights weaknesses in operational efficiency compared to the competition, which calls into question their premium valuation
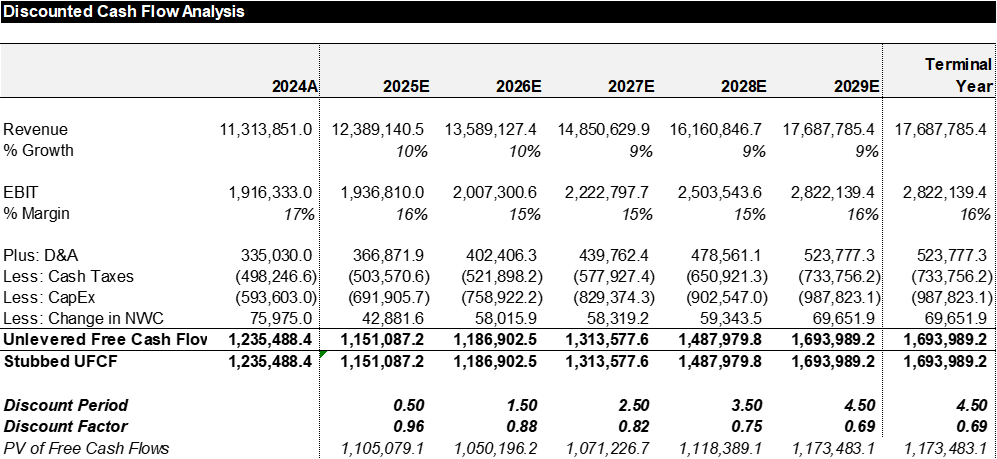
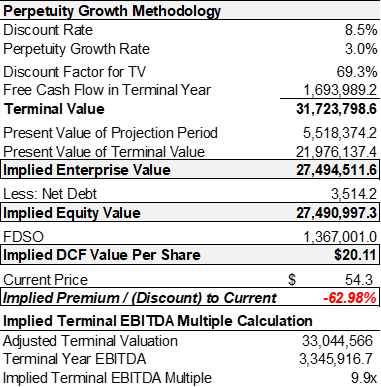
DCF Analysis
Returns Analysis
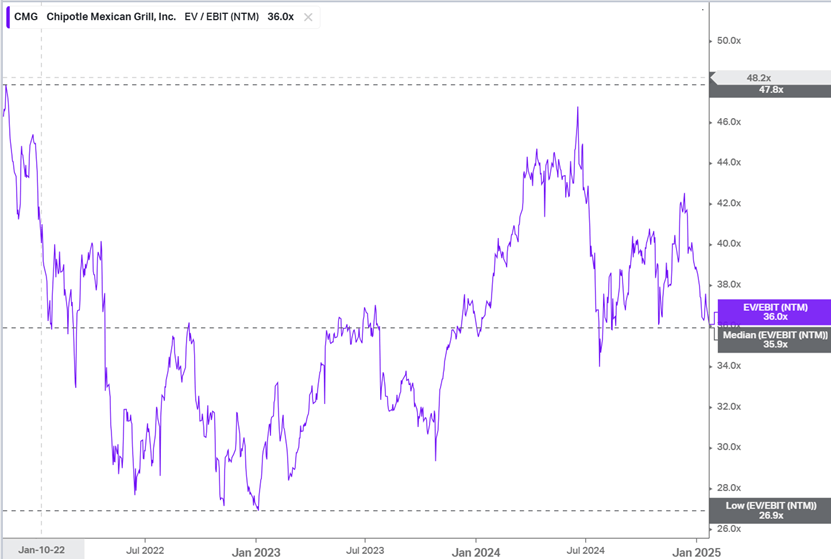
Analysis assumes a short position based on historical high, low and median TEV / NTM EBIT multiples over the past ~3 years and excludes trading fees and expenses
Model versus Consensus

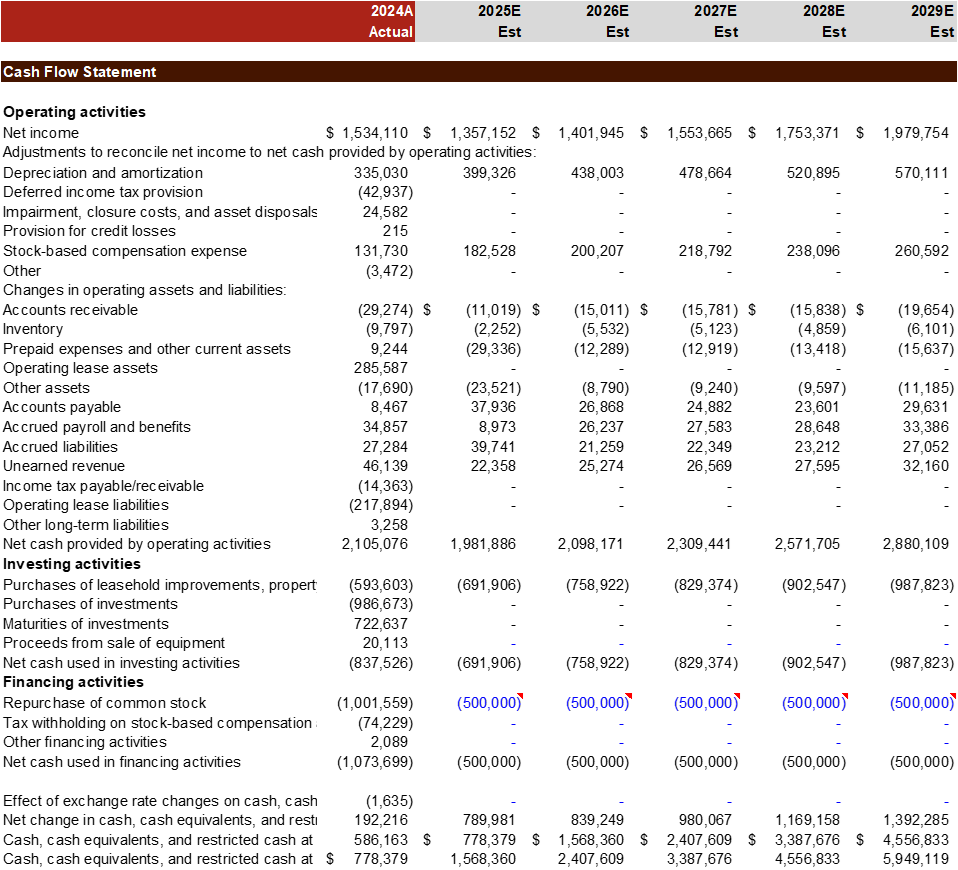
Financial Projections


Leave a comment