
Executive Summary & Recommendation
I recommend a short position in Shoals Technologies (SHLS – Nasdaq) on the basis that business fundamentals will continue to deteriorate over the next 12 months
My target price of $14.50 / share, implying a potential upside of ~35% with a ~4% risk to downside
- In the following pages I have presented a financial case after evaluating Shoals Technologies from an operational perspective, a peer trading perspective, business model, and technological perspective, informing my view that Shoals is currently trading at a material premium to the intrinsic value of the business
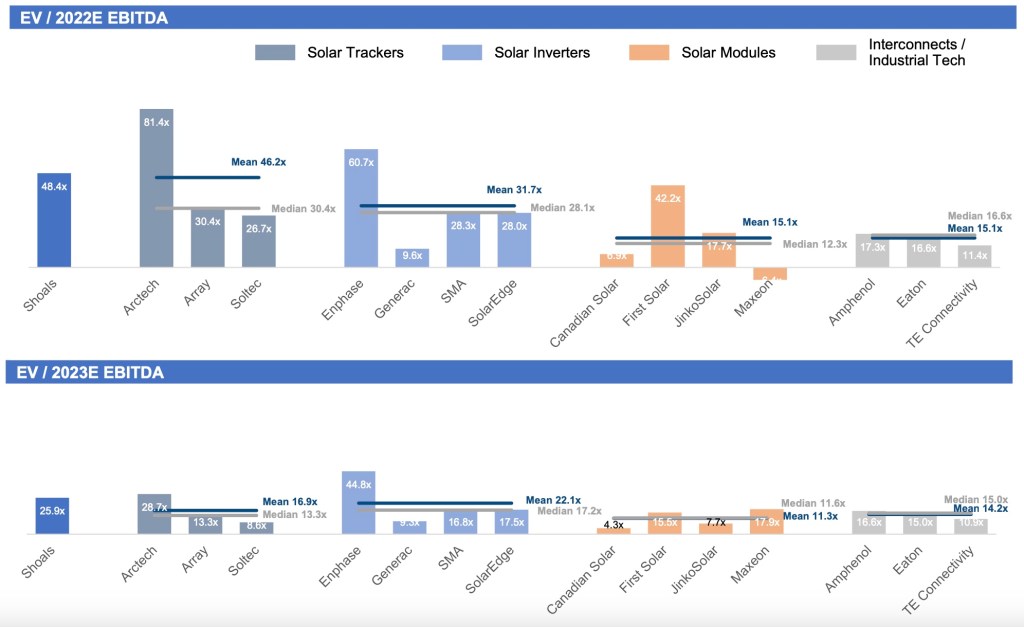
- Shoals Technologies trades at a significant premium to it’s peer set – e.g. on a 2023 EV / EBITDA basis, a 94% premium to Solar Tracker peers, 51% premium to Solar Inverter peers, 124% premium to Solar Module peers, and a 73% premium to Interconnect / Industrial Tech peers, in each case on a median multiple basis
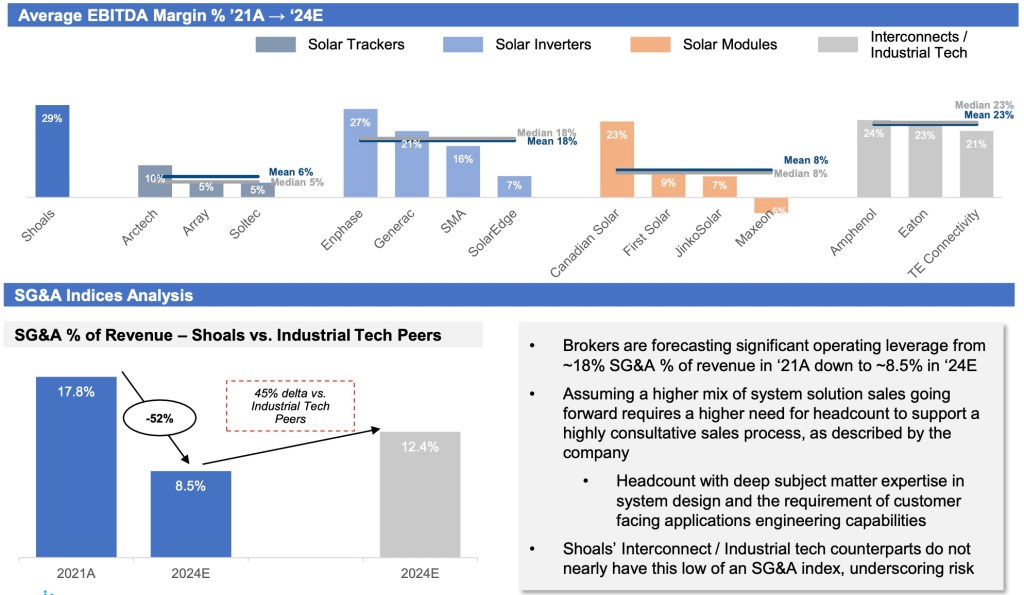
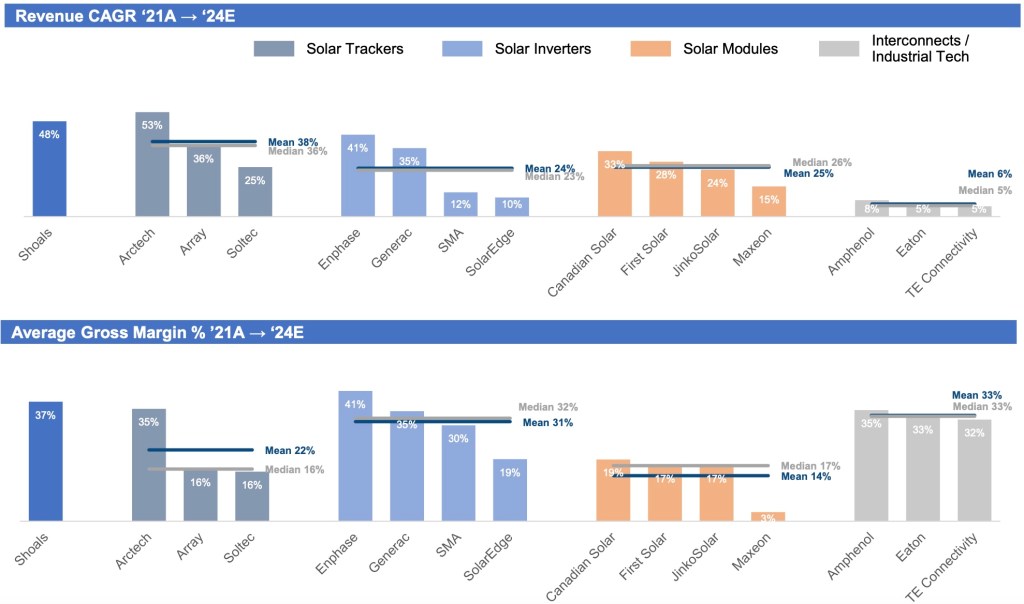
- Shoals Gross Profit and EBITDA margins are in line with or exceed their peer set; in order to maintain a competitive advantage, Shoals will need to invest extensively in R&D and SG&A, or otherwise withstand pricing pressure from larger, global interconnect peers, eroding their margins over time
- This trend is underscored by the Company’s increased SG&A spend as a % of revenue, from 9% in 2018 to 18% in 2021, in a period where a similar growth company with a competitive advantage may likely exhibit operating leverage
- Energy makes up ~20% Industrial Solutions interconnect market, the largest being Industrial Equipment (36%), followed by Aerospace and Defense
- Connector, cabling/wire harness, sensor, and fuse businesses consistently expand end-markets due to portability of the product and in order to avoid cyclicality – and over time will drive outsized competition for Shoals
- Interconnect companies with highly engineered, differentiated products (e.g. spec’d-in hermetic interconnect solutions for major defense prime platforms) generate EBITDA margins in the ~25% range)
- The solar industry is growing at a substantial rate, underpinned by stringent emissions standards globally and government subsidies, but tier 1 component providers are subject to commoditization given the scalable nature of the product
- Shoals maintains a “first-mover” advantage, having gained a few major customers, but the top 4 customer make up ~40% of revenue, presenting a revenue concentration risk; furthermore, winning a higher volume of smaller projects may further drive SG&A burden to manage customer accounts at scale
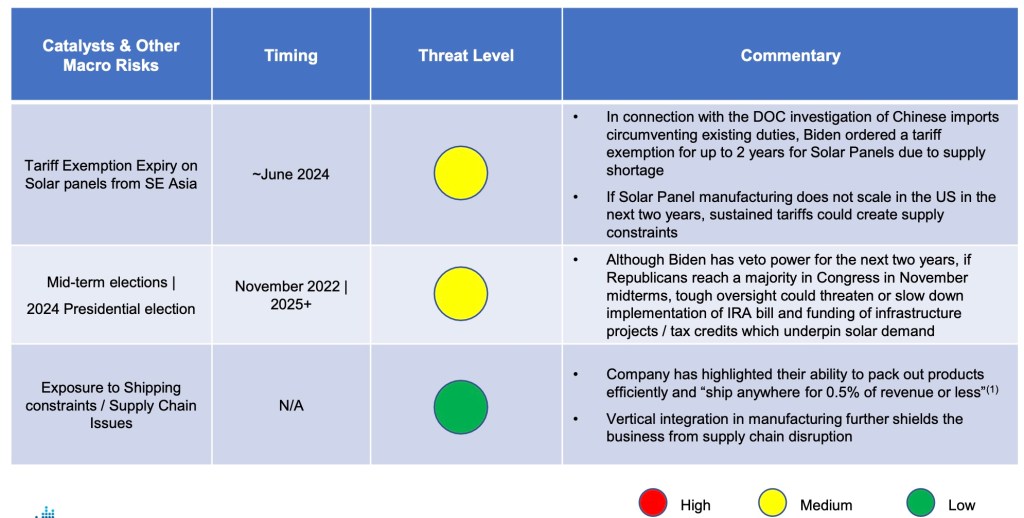
- Key macro risks have potential to impact solar infrastructure deployment (tariffs on solar panels, mid-term and presidential election impacts, and sustained global supply chain issues, although these risks are likely baked into consensus estimates given their widespread coverage
Base Case Overview & Key Considerations / Risks
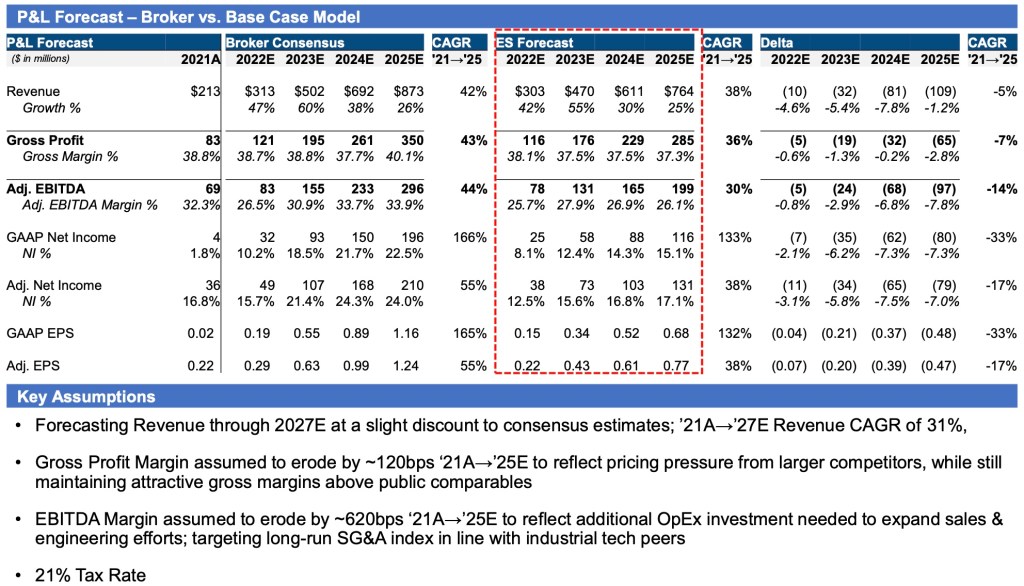
Base Case Forecast vs. Broker Consensus
My Base Case is lower than consensus forecasts, driven by lower revenue growth and higher SG&A needs, as well as a more conservative Gross Margin profile in outyears
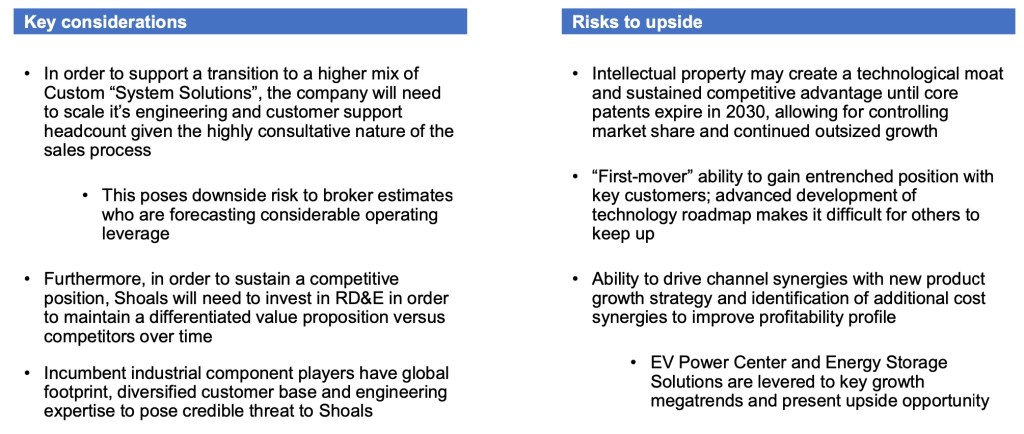
Key Considerations & Risks to Upside
A short position on Shoals Technologies faces certain key considerations and risks to the upside
OpeX Margin Analysis & Key Benchmarking
Consensus estimates for Shoals’ EBITDA margins seem unrealistic based on peer set and business model dynamics supported by increased OpEx investment
Overview of Macro Catalysts / Risks
Beyond the competitive risks concerning Shoals’ technological differentiation, there are a few key macro challenges with potential to impact earnings in the near and mid-term
Given the public nature of the events, the risk is likely baked into Consensus estimates, but we will continue to monitor the situations as they evolve
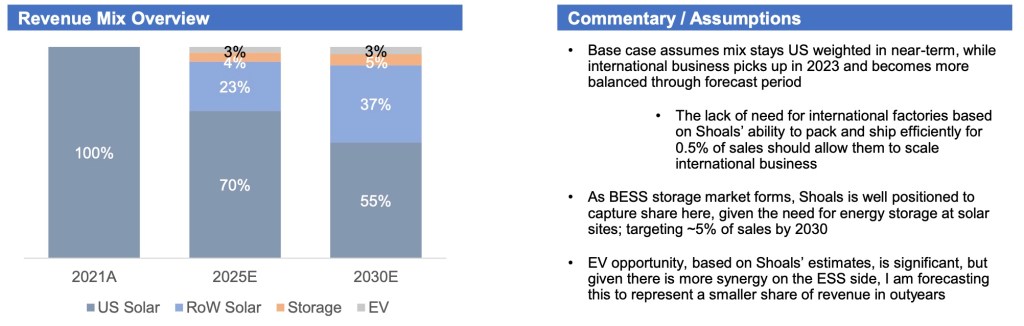
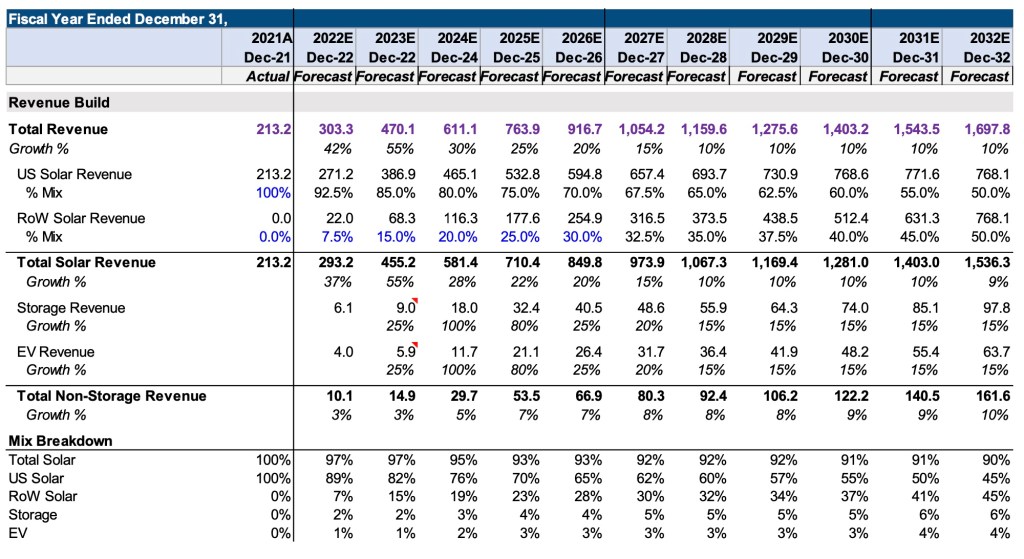
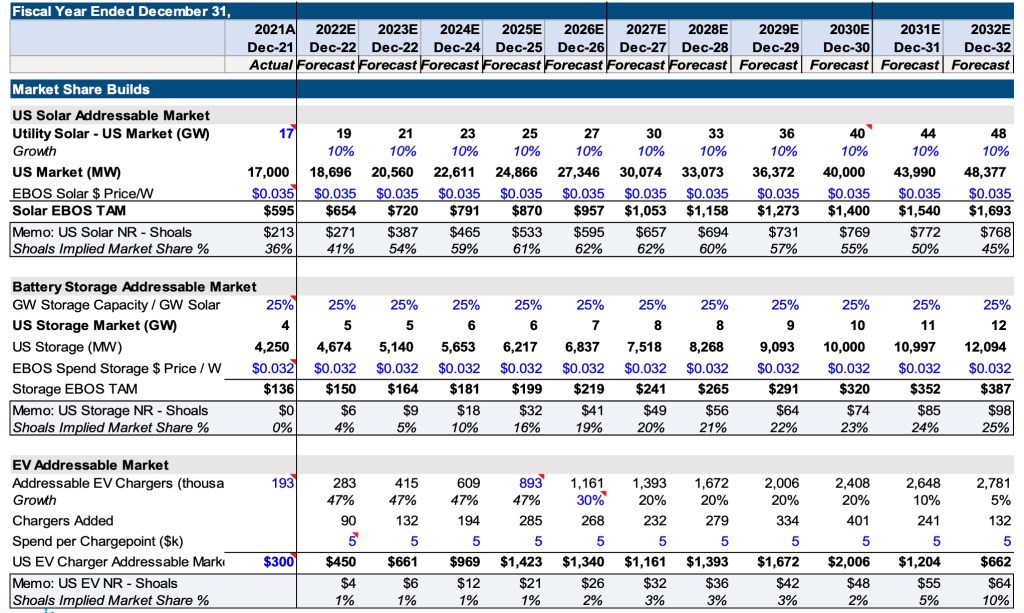
Implied Market Share & Revenue Mix Assumptions – Base Case
Valuation Analysis
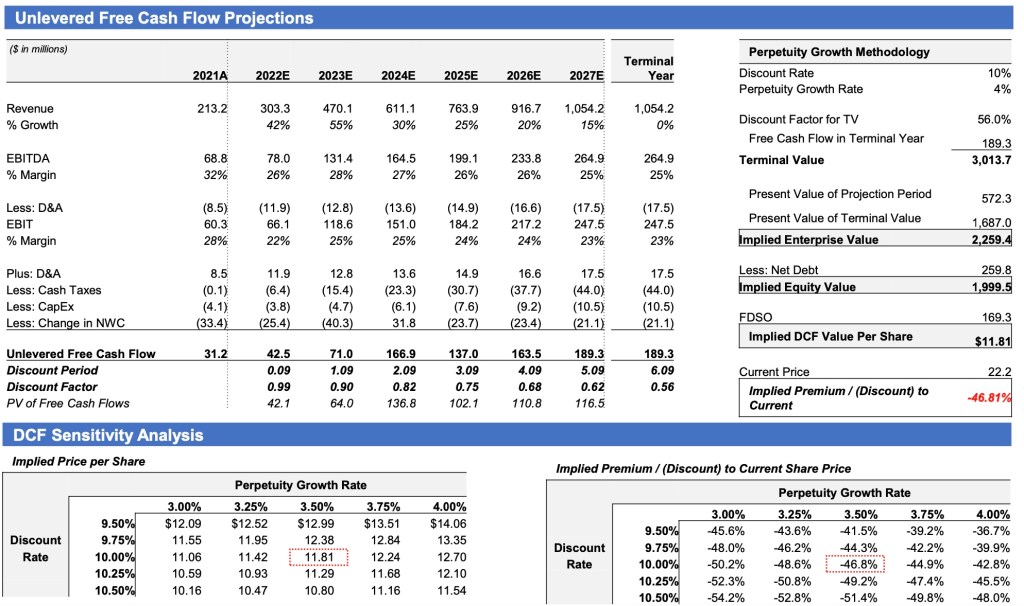
Discounted Cash Flow Analysis – 5-Year
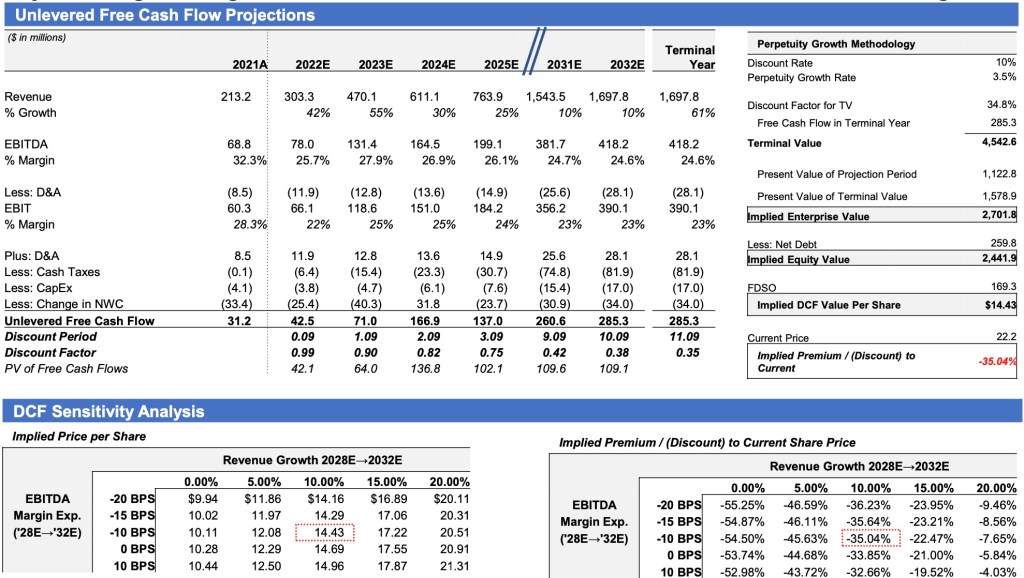
Discounted Cash Flow Analysis – 10-Year
Operational Benchmarking
Valuation Benchmarking
Revenue Mix & TAM Build Analysis Support
Revenue Mix Overview & Assumptions
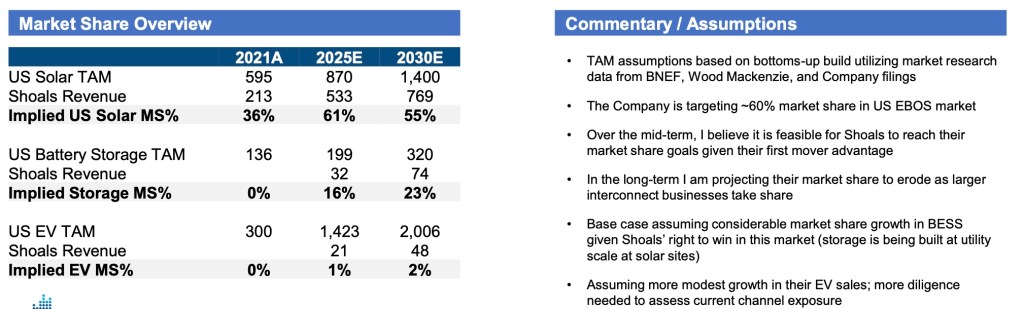
TAM Builds and Implied Market Share
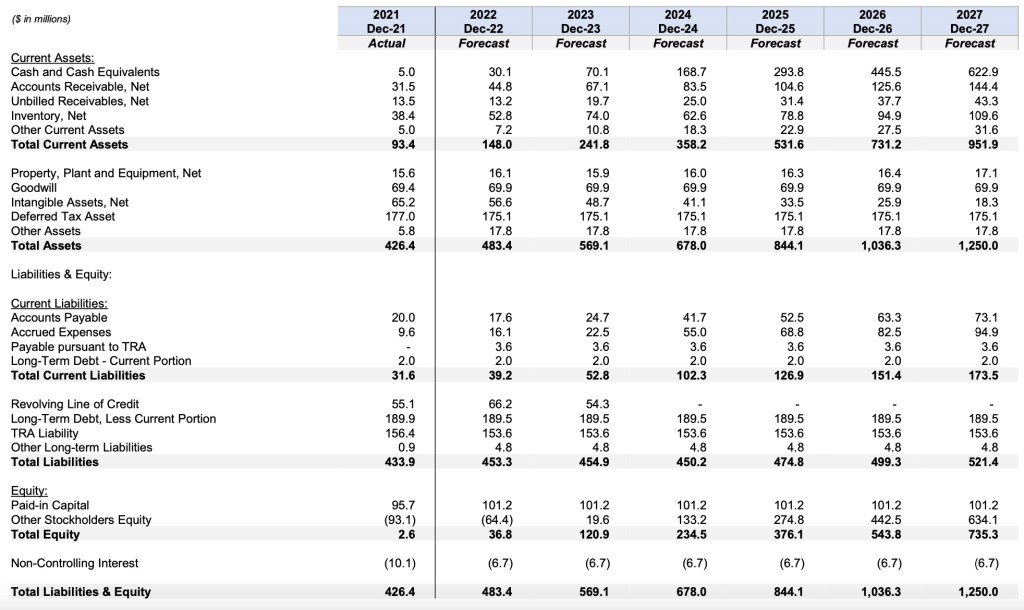
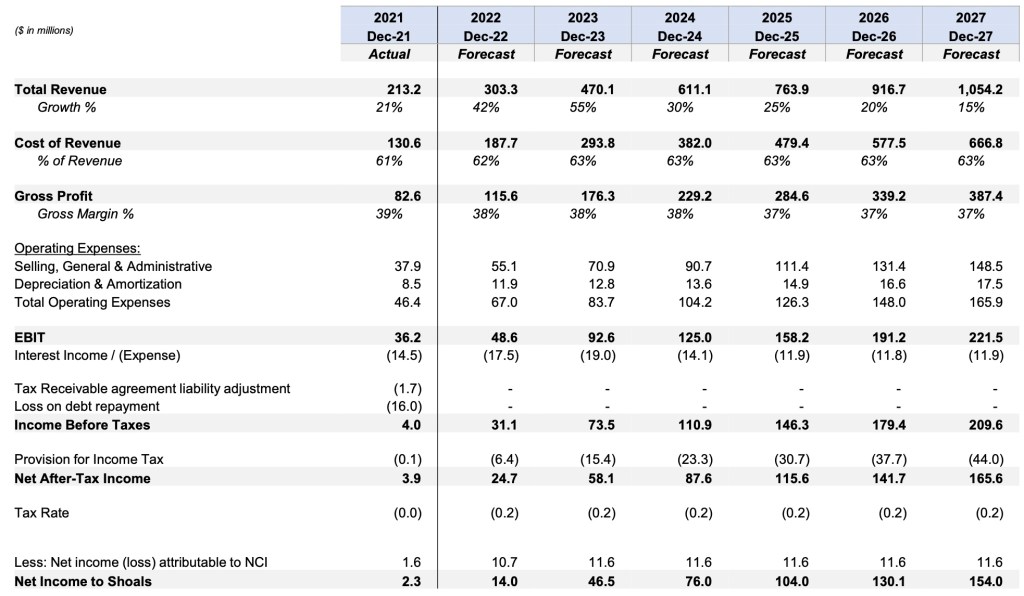
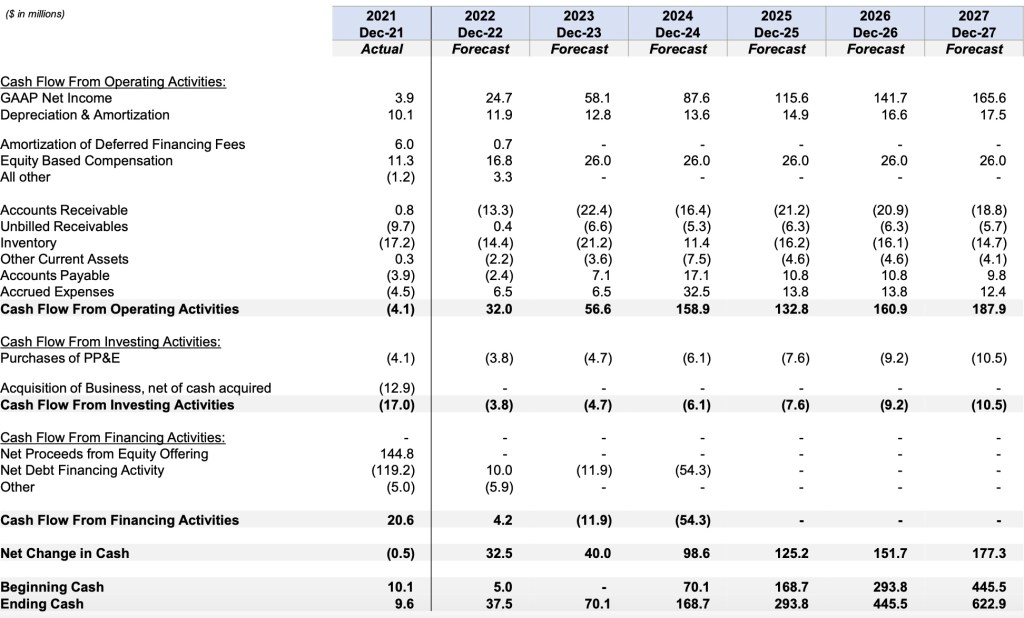
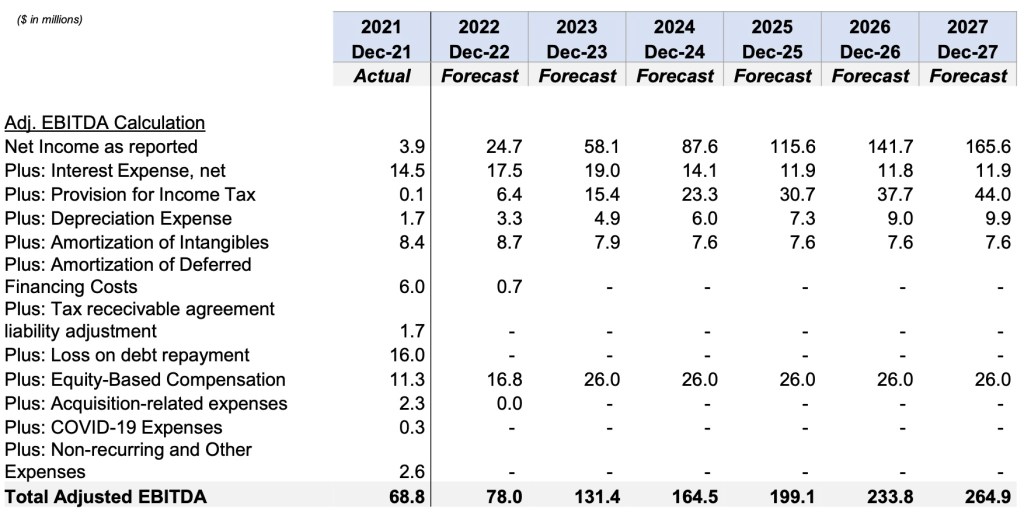
Financials Statements – Base Case
Balance Sheet
Income Statement
Cash Flow Statement
Adjusted EBITDA Reconciliation
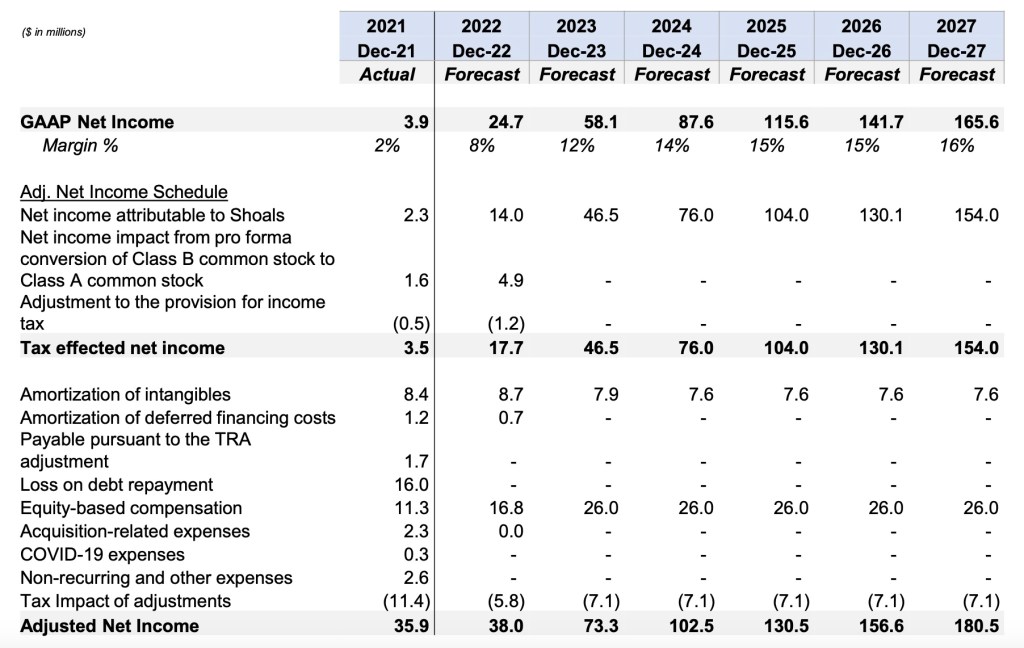
Adjusted Net Income Reconciliation
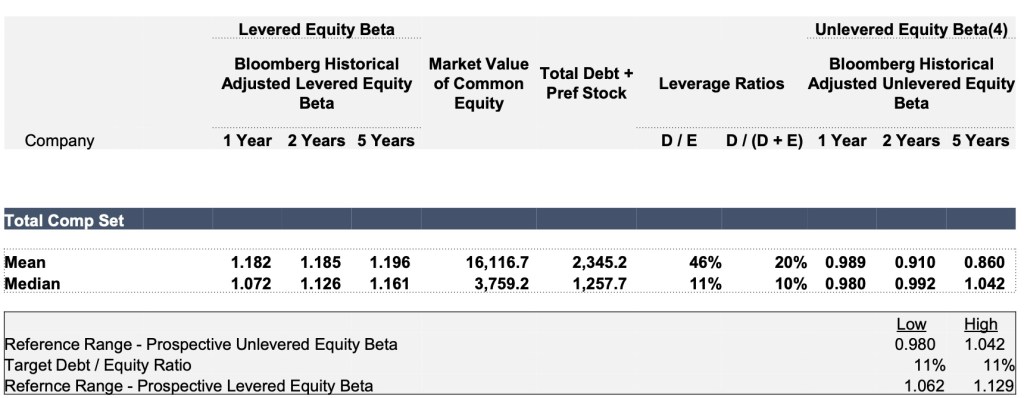
WACC Calculation & Beta Determination Detail
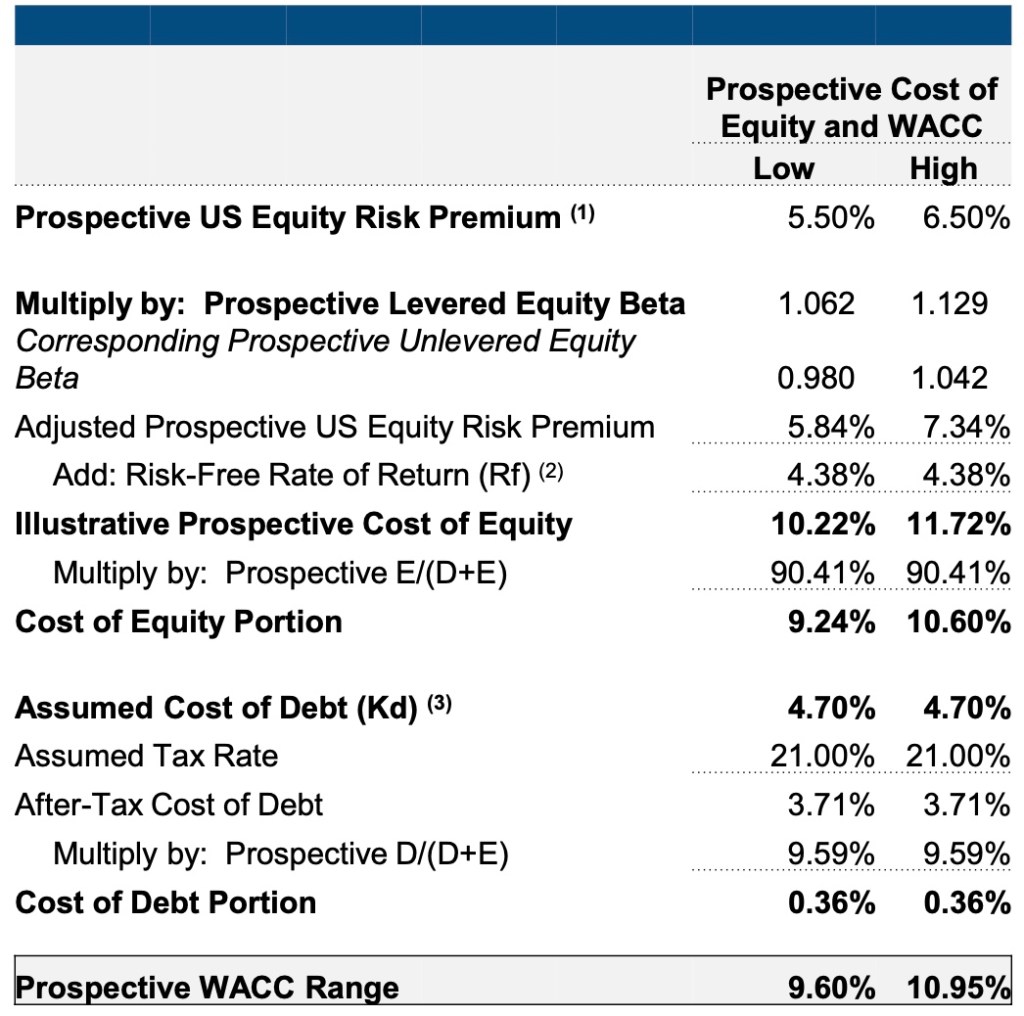
WACC Calculation
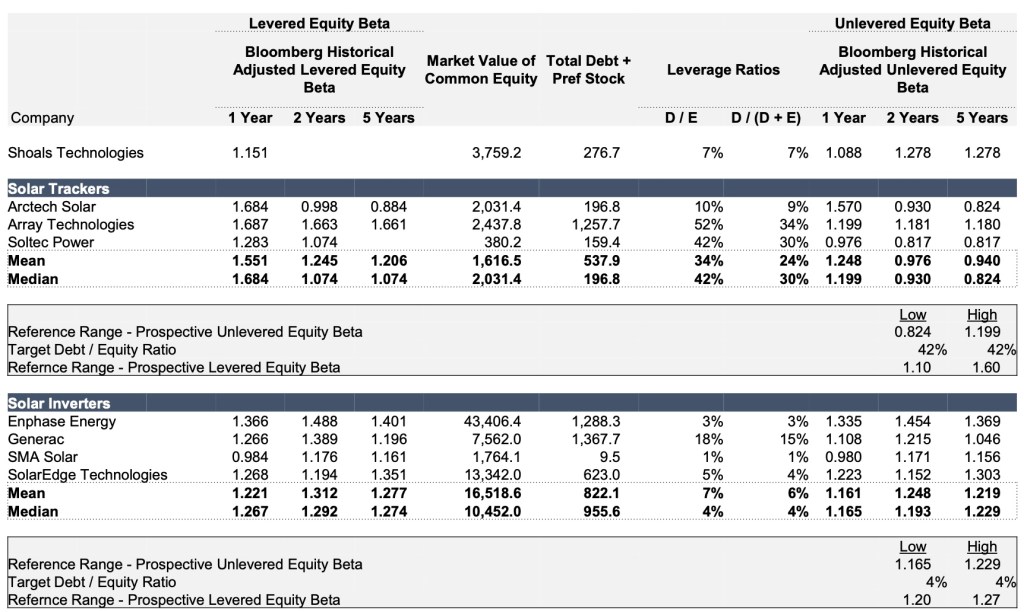
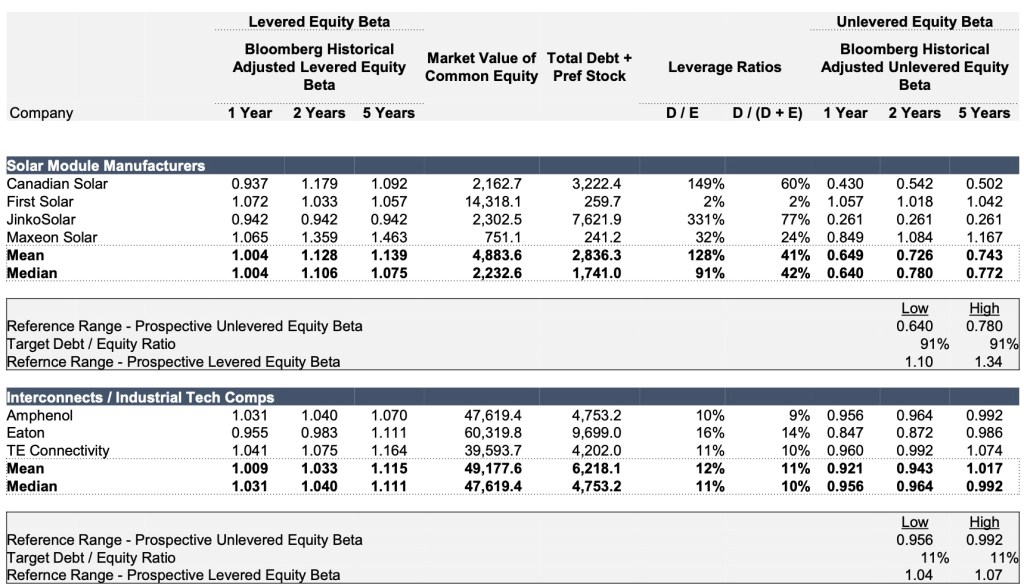
Equity Beta Review and Analysis


Leave a comment